The US economy is constantly in flux, causing economic anxiety for some and opportunity for others.
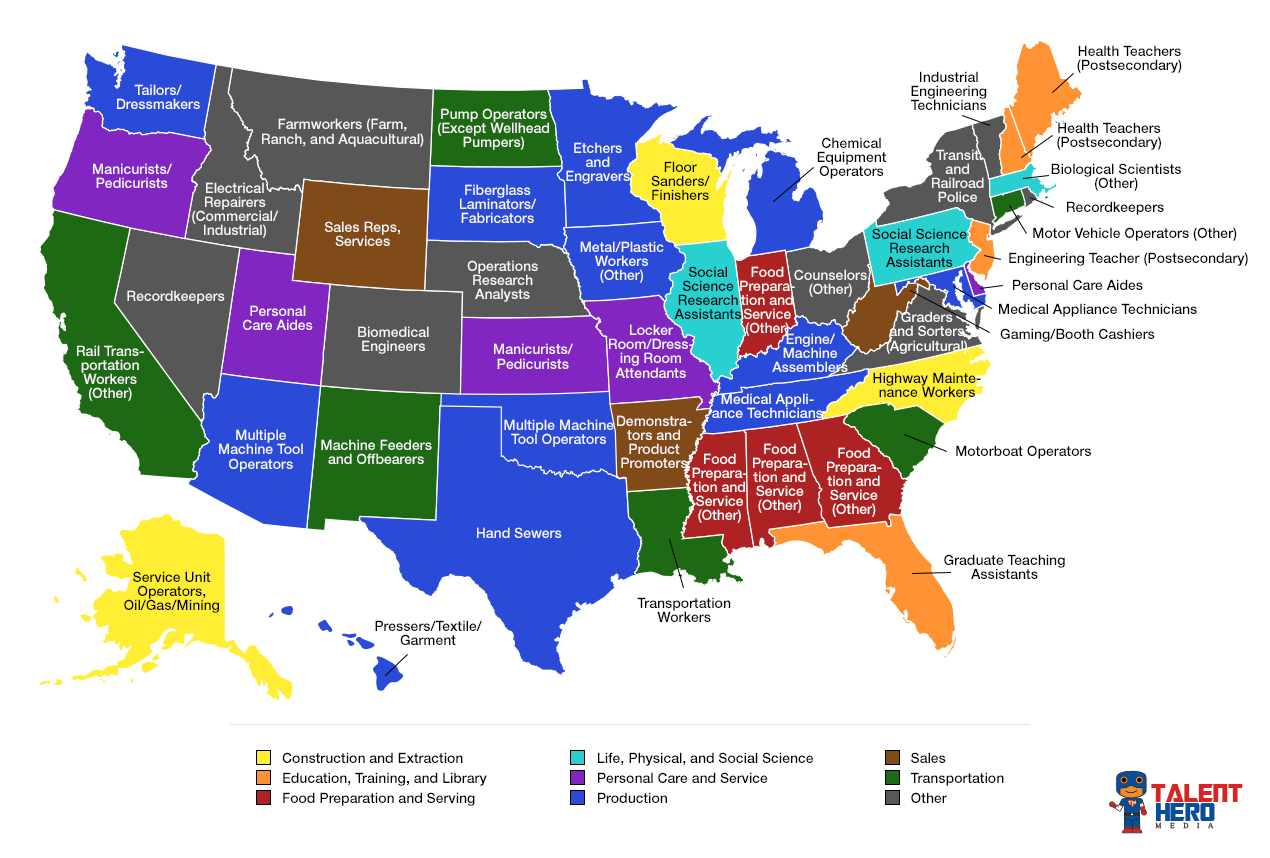
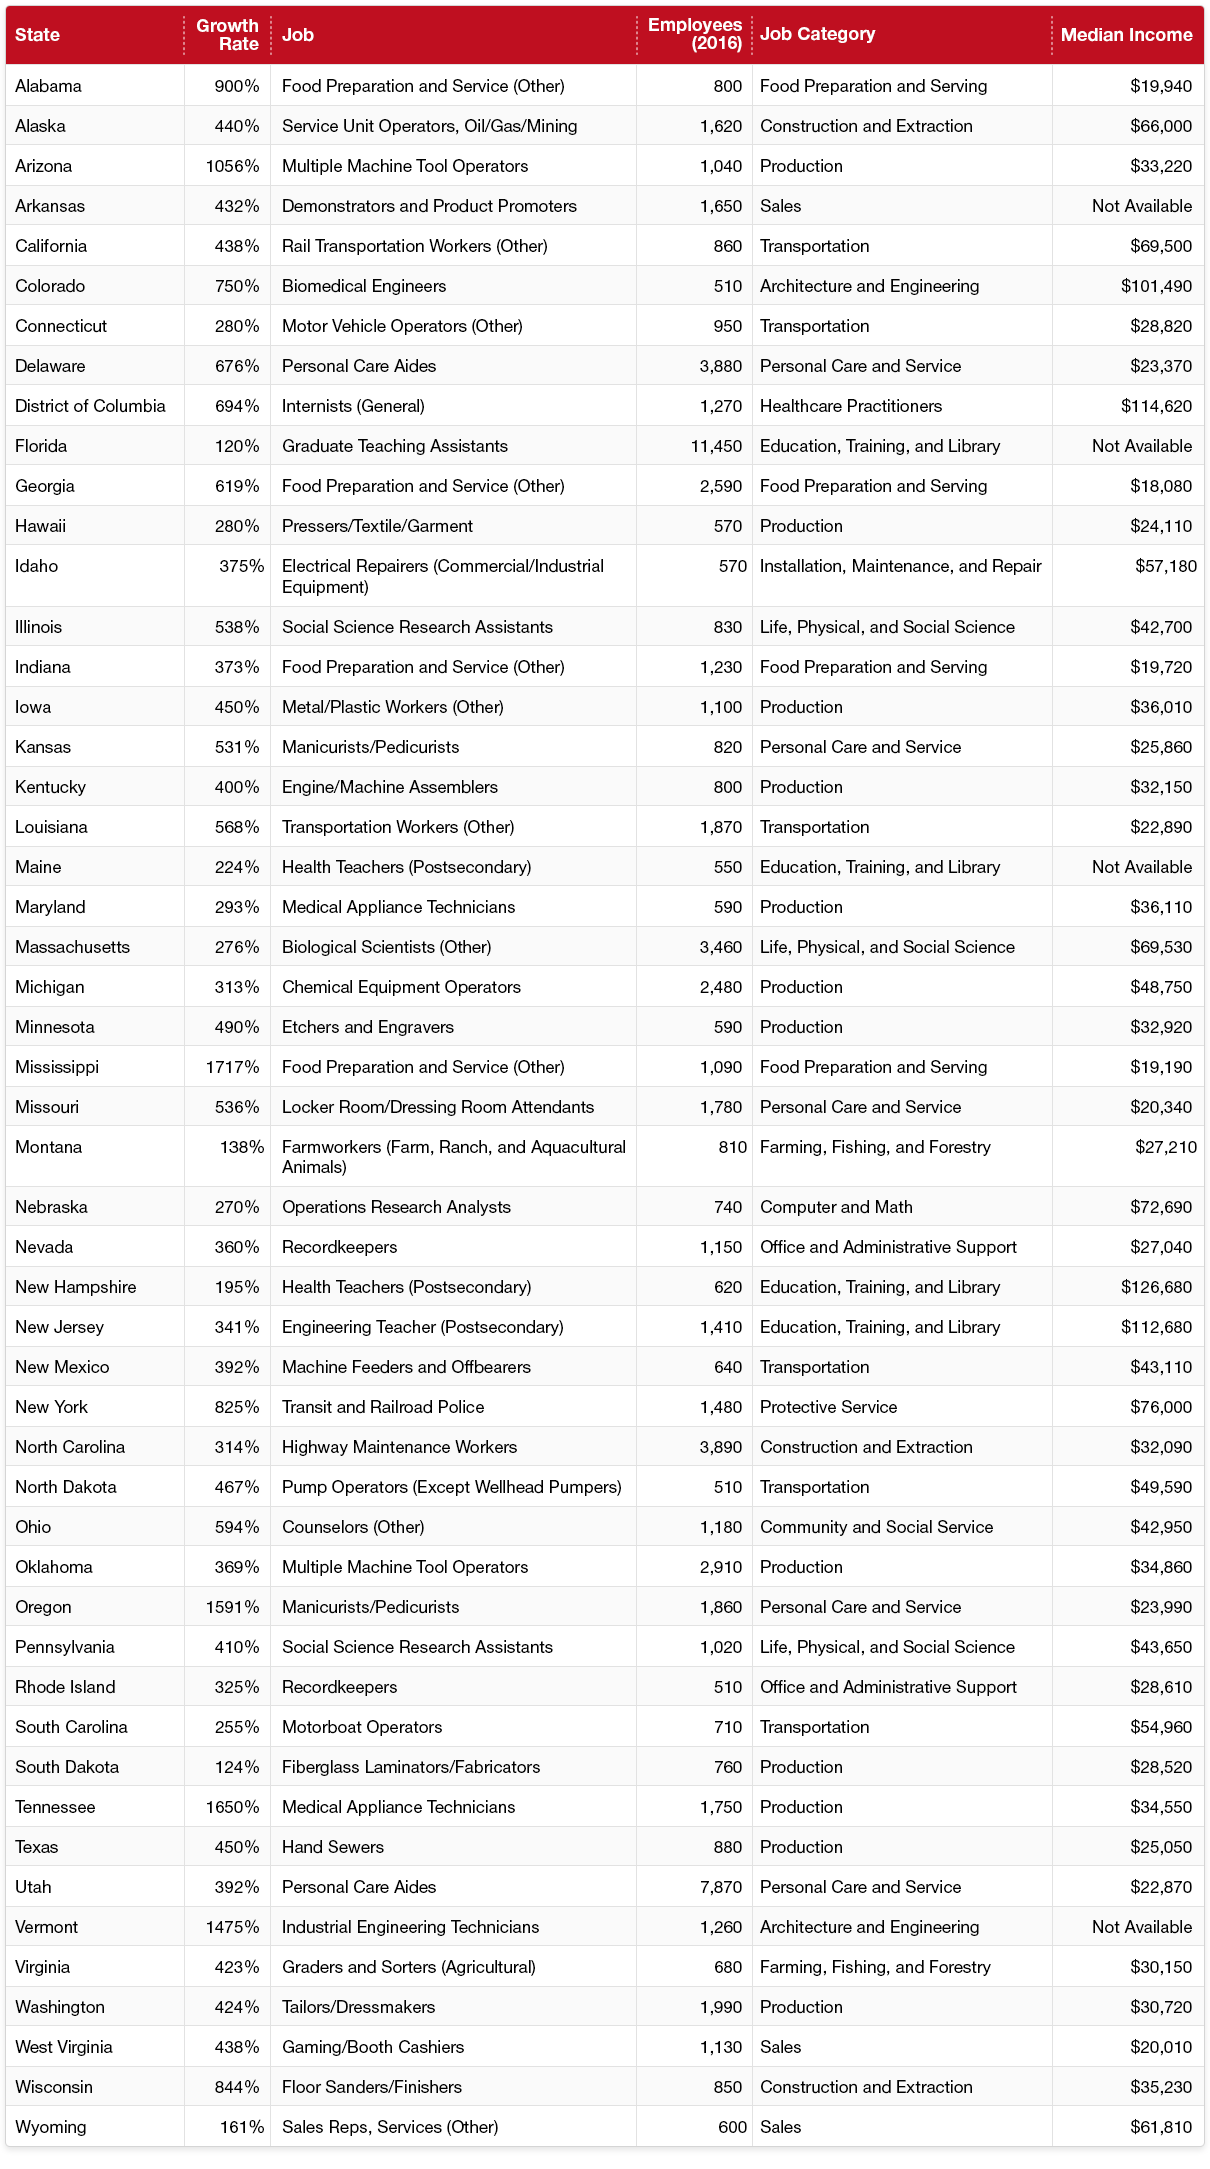
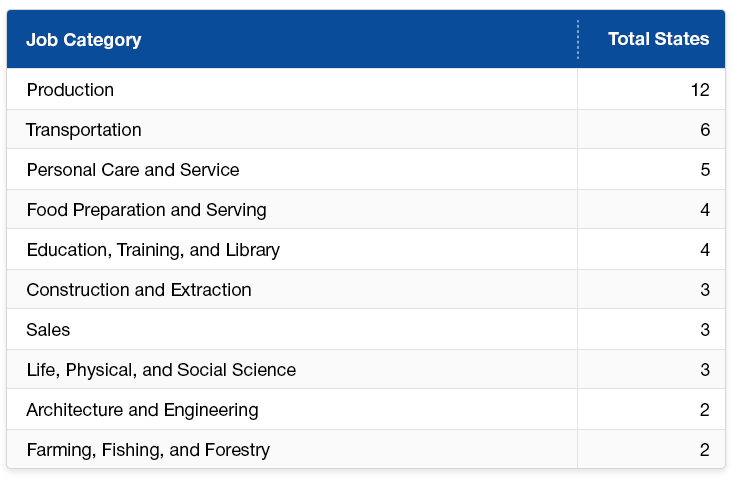
The map and tables below illustrate the changes in regional labor markets by highlighting the highest fastest growing jobs (on a percentage basis) in each state and the classification associated with each occupation.
Also, check out our map illustrating how jobs are concentrated across the US for an interactive view of the country.

The highlights
- The fastest growing jobs don’t pay well – Of the fastest growing jobs in each of the 50 states plus Washington, D.C., only 12 pay more than a median income of $50,000.
- The job category with the greatest number of fast growing jobs is not what you’d think – Amid the constant discussion about the decline of US manufacturing, it is a bit surprising that the the fastest growing job in approximately a quarter of states is classified in the Production category.
- The states with the lowest per capita incomes (Mississippi, West Virginia and Alabama*) tend to have job growth in low-paying jobs – The average of the median income of the fastest growing job in these three states is only $19,713.
The tables


Methodology
For each US state and Washington D.C., we determined the fastest growing job between 2011 and 2016 where a minimum of 500 people were employed in the occupation as of 2016. All data was obtained from the Occupational Employment Statistics (OES) Survey.
*Arkansas has the third lowest per capita income (after Alabama) but the OES survey does not have median income available for the Demonstrators and Product Promoters job.


